Value investing · Educational
The Other Half of the Return: Why the Dividends You Reinvest Quietly Do a Big Part of the Work
The number on the news is often only half the story. A plain look at price return, total return and what happens when the cash a company pays you is put back to work.
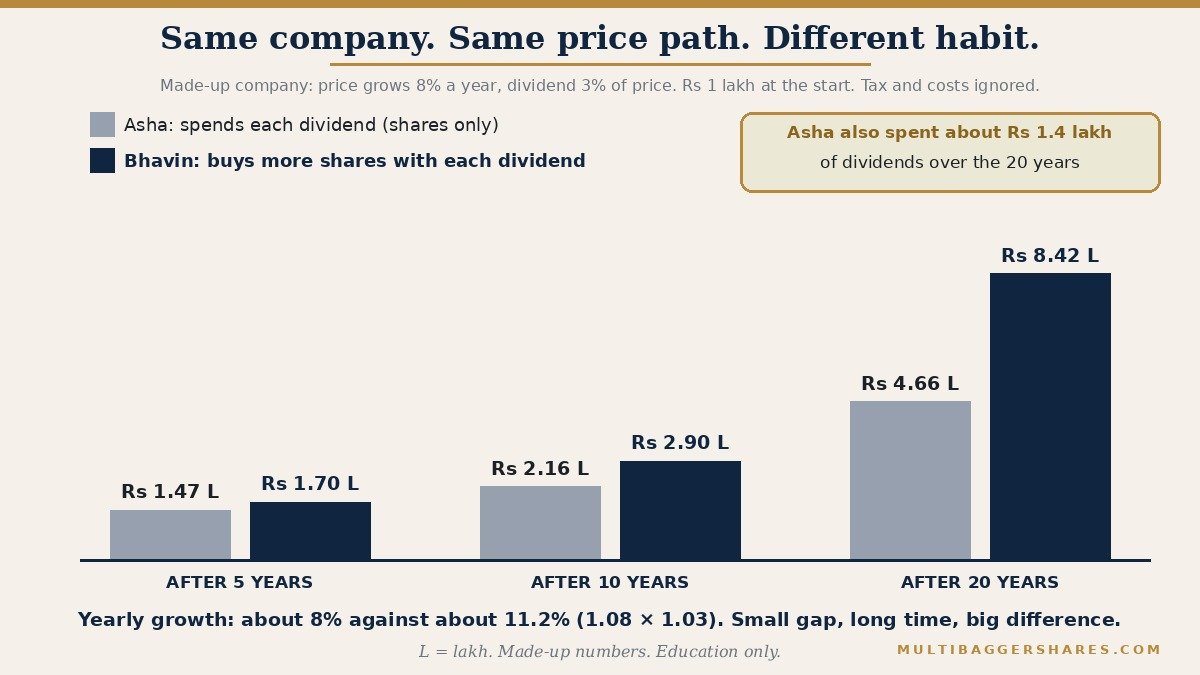
Asha and Bhavin are neighbours, and each has Rs 1 lakh to invest. Everything about them and the company below is made up to teach one idea. They both put the whole amount into the same steady business. For this story, its share price grows 8% every year, without a single bad year. The company also pays a dividend (a share of its profit that it hands to its shareholders in cash) equal to 3% of the share price each year. Real life is never this smooth. But a smooth story lets us see one thing clearly.
Asha takes her dividend each year and spends it. A family dinner, a gift, a small treat. Bhavin does something else. Every year he uses his dividend to buy a few more shares of the same company. That is all. No extra money, no special skill, no guessing about the market. Then twenty years go by.
At the end, Asha’s shares are worth about Rs 4.66 lakh. Along the way she also collected and spent about Rs 1.4 lakh of dividends. Bhavin’s holding is worth about Rs 8.4 lakh. It is the same company, the same price path and the same starting money. Bhavin simply let the cash keep working instead of leaving the table.
What it really means
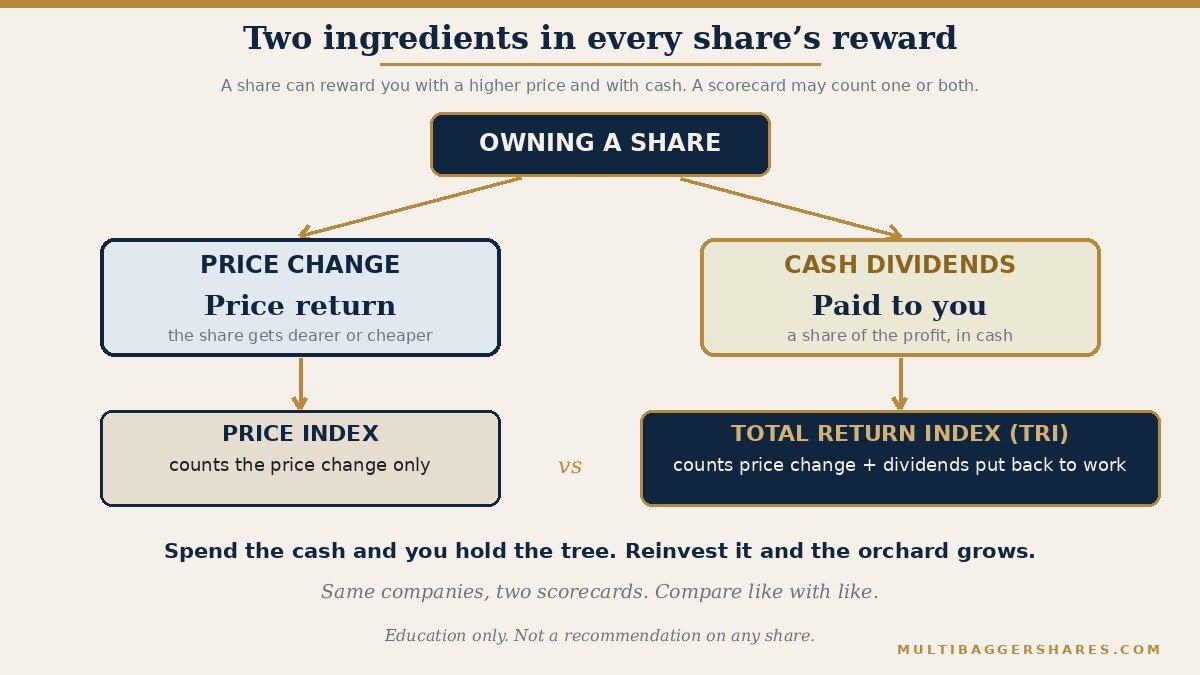
A share can reward you in two ways. First, its price may rise. The finance word for this is price return (the change in the share price over a period). Second, the company may pay you dividends in cash. Put both together and you get total return (the full reward of owning a share: the price change plus the dividends). When someone tells you only the price part, you have heard half the story.
This is easy to miss because of how the market is reported. A market index (a basket of shares used as a thermometer for the whole market) is quoted every evening on the news. The Nifty 50, for example, follows 50 large listed Indian companies. The level you see on television is a price index (it counts only changes in share prices, not the dividends the companies paid). NSE, the exchange that runs it, also publishes a Total Return Index, or TRI (the same basket, but it counts the dividends as if they were put back into the index). Same 50 companies. Two different scorecards.
How is a total return index built? The idea is simple. Each time one of the 50 companies pays a dividend, the index assumes that the cash is used to buy more of the same basket on that day. So the total return index quietly does what Bhavin does. The price index does what Asha does: it lets the cash walk out of the door and forgets about it. Neither number is wrong. They answer two different questions, and the trouble starts only when we mix them up.
You already know this idea from the bank. A payout fixed deposit sends the interest to your account every quarter or month. A cumulative fixed deposit adds the interest back into the deposit, so the next interest is earned on a bigger amount. Same bank, same rate, but after ten years the two end in very different places. Reinvesting dividends is the share-market version of the cumulative deposit.
Why it works
The engine is compounding (earning returns on your past returns, like a snowball rolling downhill that picks up more snow as it grows). When Bhavin reinvests, his dividend buys new shares. Next year those new shares earn their own price rise, and they pay their own dividends. The snowball grows from the sides as well as from the top.
Look at the arithmetic of the story. Asha’s shares grow 8% a year in value. Bhavin’s holding grows by about 11.2% a year, because his share count grows by 3% and the price grows by 8% (1.08 × 1.03 is about 1.112). That is only three points more per year, which looks small. But repeated for twenty years, 8% turns Rs 1 lakh into about Rs 4.7 lakh, while 11.2% turns it into about Rs 8.4 lakh. Small gaps, repeated for a long time, become big ones. That is the whole secret of compounding, and it does not need any cleverness.
Watch how the gap grows with time. After five years, Asha’s shares are worth about Rs 1.47 lakh and Bhavin’s holding about Rs 1.70 lakh. A small lead. After ten years it is about Rs 2.16 lakh against Rs 2.90 lakh. After twenty years it is Rs 4.66 lakh against Rs 8.42 lakh. Notice that the second ten years add far more to the gap than the first ten. Asha has been spending her dividends all this time, about Rs 0.4 lakh in the first ten years and about Rs 1.4 lakh over the full twenty, and even counting that, Bhavin is well ahead. The snowball needs time before it looks impressive, which is why people who stop early rarely see what it can do.
One honest point, so that nobody feels tricked. A dividend is not free money from the sky. On the day a company pays a dividend, its share price usually drops by about that amount, because the cash has left the company and gone into your pocket. So the dividend is not a gift on top of what the business is worth. It is a part of what the business earned, handed over to you. The real choice comes after: do you spend that cash, or do you put it back to work?
The same is true inside the company. A business can also keep its profit and reinvest it in new machines, new shops or new products, and if it does that well, the share price tends to rise over time. Neither route is better in every case. The lesson here is not “prefer dividends”. The lesson is “count everything you earned, and do not let it go to waste”.
This also tells you what to ask about a business. Some companies pay no dividend at all, and that is not a flaw. If a business can put its profit back into its own operations at a high rate of return (profit earned on the money put in), keeping the cash may help you more than receiving it. If a business cannot find good uses for its cash, sending it to the owners is the honest thing to do. So the better question is not “does it pay a dividend?” but “what does this business do with the cash it earns, and does it do it well?” That is a question about quality, and it is one an ordinary reader can learn to ask.
A real example or two
Now the real thing. NSE’s factsheet for the Nifty 50, dated 30 September 2026, shows two five-year growth rates (CAGR, which means the steady yearly rate that would give the same result). The price return is 5.13% a year. The total return is 6.38% a year. Same 50 companies. Same five years. The gap is about 1.25 points a year, and that gap is the dividends and what they earned.
In rupees, using those two rates, Rs 1 lakh grows to about Rs 1.28 lakh on the price scorecard and about Rs 1.36 lakh on the total return scorecard. That is nearly Rs 8,000 more, or about 6% more money, from the same companies in the same five years. This is index arithmetic. It is not what any single investor earned, because real investors also pay costs and taxes. It only shows how much the price number leaves out.
Look at a much longer record. Hartford Funds, a US fund company, reports (using Compustat data up to January 2024) that about 34% of the total return of the S&P 500 since 1940 can be attributed to reinvested dividends and the compounding of them. The S&P 500 follows 500 of the largest listed American companies. In plain words, roughly one rupee in every three that long-term owners earned came from this quiet source. It varies from one decade to another, and the past does not promise the future. But it is not a rounding error.
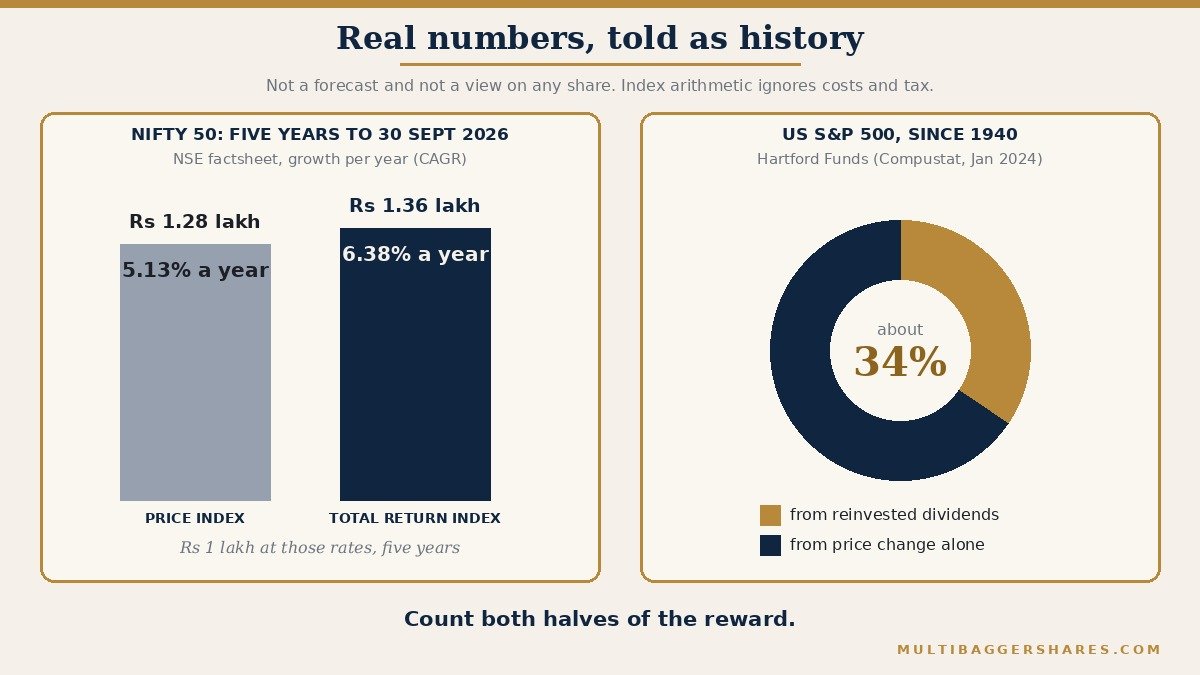
Notice the pattern in the five Indian years above. When prices rise slowly, dividends become a bigger slice of the reward. When prices are rising fast, the price part shouts and the dividend part whispers. In both cases it is there. The investors who hear only the shouting miss part of the music.
How you can use it
First, when you hear that “the market returned” some number, ask one small question: does it include dividends? Compare like with like. A price index belongs next to a price number. A total return index belongs next to a number that includes the cash received. If you compare your portfolio, which received dividends, with an index that ignores them, you will judge yourself unfairly, in one direction or the other.
Second, look at your own account in the same way. When you check how you have done, make sure the dividends you received are counted in the result. Many people look only at the change in value and forget the cash that came into the bank on the way.
Third, notice that you always have a choice, just as with the two kinds of fixed deposit. Dividends can be spent or put back to work. Neither is wrong. Some people need the income and that is a perfectly good reason to spend it. But if you do not need the cash today, remember what the snowball does with it over twenty years.
Mutual funds in India offer the very same choice. The growth option keeps everything inside the fund, so any income is automatically put back to work. The IDCW option (income distribution cum capital withdrawal, the newer name for the old dividend option) pays out part of the fund’s value from time to time. The idea is exactly the payout deposit and the cumulative deposit again. Read the name of the option before you read the number. Also note that in a year when share prices fall, the same dividend buys more shares than before, so reinvesting quietly does more work at exactly the time when people feel least like working. This is a description, not advice, and it does not tell you what is right for you.
Fourth, keep tax in mind. Under current Indian rules, dividends you receive are added to your income and taxed at your slab rate, whether you spend them or reinvest them. Our example ignored tax to keep the idea clear, and real results will be lower. Rules change, so check the current position or ask a qualified professional.
Fifth, do not turn this into a chase for the highest dividend. A very high payout can be a warning sign rather than a prize, and that is a different lesson for another day. The point here is smaller and calmer: count the cash, and do not waste it. Benjamin Graham, the teacher of Warren Buffett, wrote in The Intelligent Investor (1949) that the true investor “will do better if he forgets about the stock market and pays attention to his dividend returns”. He was pointing to the same thing: a share is a part of a business, and a business pays you.
There is calm in this habit. You cannot know next month’s price. But you can know that the cash a good business sends you is a real part of your reward, and that it can be sent back to work. This article is for education only. It does not tell you what to do with any particular share, fund or sum of money.
Key takeaways
- A share rewards you in two ways: the change in its price (price return) and the cash it pays you (dividends). Together they make total return.
- Most market numbers on the news are price indices, which leave dividends out; a Total Return Index counts them as if they were put back to work.
- In the made-up story, the same company and the same starting Rs 1 lakh became about Rs 4.7 lakh for Asha, who spent her dividends, and about Rs 8.4 lakh for Bhavin, who reinvested them.
- In NSE’s 30 September 2026 factsheet the Nifty 50 grew 5.13% a year on price and 6.38% a year on total return over five years, and Hartford reports about 34% of the S&P 500’s return since 1940 came from reinvested dividends.
- A dividend is part of what the business earned, not a free gift, so the choice is what you do next: count it, tax it, and decide whether to spend it or put it back to work.
Educational content. This article is for education only. It is not a research report and not a recommendation to buy, sell or hold any security, and it does not take your personal circumstances into account. The securities quoted are for illustration only and are not recommendatory.
Investment in securities market are subject to market risks. Read all the related documents carefully before investing.
Registration granted by SEBI, enlistment as RA with Exchange and certification from NISM in no way guarantee performance of the intermediary or provide any assurance of returns to investors.

Manish GoelChartered Accountant and SEBI Registered Research Analyst (INH100004775). Writes about business quality, valuation and investor behaviour. About